Monte Carlo retirement apps: how market stress tests work
Short answer
A Monte Carlo retirement app runs your plan through many possible market paths and reports how often your money lasts. It answers a question a single average return can’t: what happens if bad years come early? Read the success rate as a measure of cushion, not a promise, and check how the app builds its scenarios.
- What it is
- A stress test that repeats your plan with different market returns and counts the share of runs that succeed.
- Who it helps
- Anyone living on investments, especially in the first 10 years of retirement.
- When to use it, and the catch
- After you set spending and benefit ages. The catch: results depend on the return, volatility and lifespan assumptions, and a percentage can feel more certain than it is.
Example: Two retirees each start with $1,000,000, withdraw $4,000 a month for 30 years and get the same average growth. If a 30% crash hits in year one, about $32,000 is left at the end; if it hits in the final year, about $1.43 million is left. Only the order changed. Try it below.
WisePlan Wealth is a retirement planning app for iPhone, iPad, Mac and Android. Its Market Resilience score tests your plan against blocks of real market history, for Canada or the United States.
Sequence-of-returns calculator
How this estimate works
- Two paths with the same total growth over the period: one crash year and every other year at the same return.
- Path A has the crash in year 1; path B has it in the final year. Withdrawals are taken at the start of each year (12 × monthly).
- Inflation and taxes are not included. The default 5% average return and 30% crash are examples, not forecasts.
Runs in your browser. Nothing is saved or sent.
Stress-test your own plan against real market historyAn estimate for education. Real markets have many bad years, not one.
Why one average return isn’t enough
When you are withdrawing money, the order of returns matters. Losses early in retirement force you to sell more units at low prices, leaving less to recover. That is sequence-of-returns risk, and it is the main reason to run a stress test. Guides: sequence of returns, the 4% rule, longevity risk.
Three ways apps build scenarios
- Random (statistical) Monte Carlo. Returns are drawn from a distribution with the average and volatility you set.Strength: many scenarios, including ones worse than history. Weakness: may miss real patterns such as several bad years in a row.
- Historical sequences. Your plan is run through each real stretch of past returns.Strength: real crashes and recoveries. Weakness: only so many historical starting years.
- Block bootstrap (a blend). Scenarios are stitched together from blocks of real years.Strength: keeps real multi-year patterns while creating many scenarios. Weakness: still based on the past.
How three apps describe it
From each company’s own site, checked 7 October 2026. This is not a ranking.
Boldin
- Monte Carlo
- Listed in PlannerPlus ($144 a year), not Basic. Boldin says it runs 1,000 simulations and shows a Chance of Success.
- Source
- Boldin pricing, Boldin vs ProjectionLab
ProjectionLab
- Monte Carlo
- Monte Carlo simulations and historical backtesting are listed in the free Basic plan.
- Source
- ProjectionLab pricing
WisePlan Wealth
- Market Resilience
- 7-year blocks of real historical returns and inflation, run over the life expectancy you enter, with volatility scaled to your settings. Success means the plan pays its spending and leaves more than your Minimum Legacy. Version 1.8 adds a Success Probability chart.
- Source
- App Store 1.8 notes, Google Play
More on each: Boldin alternative, ProjectionLab alternative, and the full retirement planning apps comparison.
How to read a success rate
- Find out what “success” means. Money left above $0? Above a legacy goal? Spending fully paid after tax every year?
- Check the lifespan. A plan to 95 is a harder test than a plan to 85.
- Look at the bad cases, not just the percentage. When money runs out, at what age, and by how much?
- Use it to set spending. Raising or lowering monthly spending is the most direct way to move the score.
- Re-run it yearly. After a good or bad year, the answer changes.
Planning the years around retirement? See retirement planning at 60; doing it yourself, see DIY retirement planning.
Market Resilience in WisePlan Wealth
- Real history: 99 years of annual returns and inflation (1926 to 2024), drawn as 7-year blocks so real crashes and recoveries stay together.
- Your assumptions: blocks are adjusted to the average return you set, and volatility follows your settings.
- Your lifespan: the life expectancy you enter, not random lifespans.
- A strict pass: spending fully covered after income tax and the OAS recovery tax, ending above your Minimum Legacy.
- Charts: a Success Probability chart (new in 1.8) shows the spread of results across all scenarios.
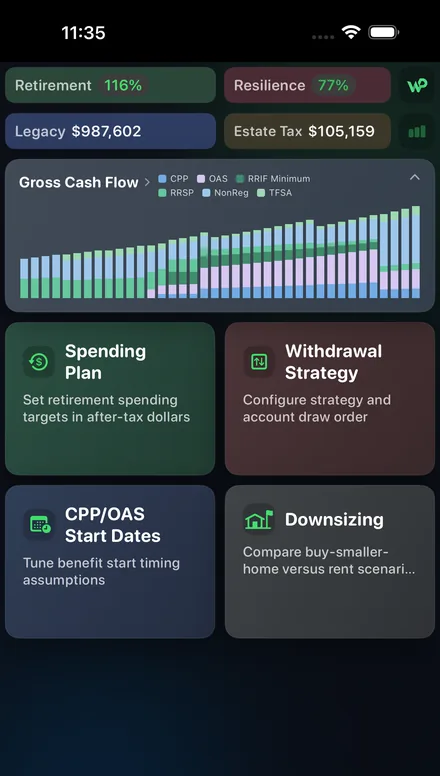
Will your net worth last?
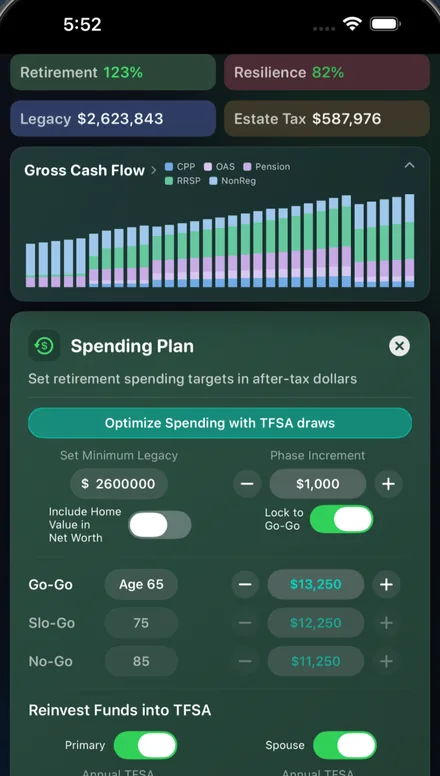
How much you can spend monthly
Terms in plain language
- Success rate
- What it is: the share of simulated market scenarios in which your plan meets its goal. Who it helps: anyone comparing spending levels or retirement dates. When to use it: after your inputs are complete. The catch: it depends on how the app defines success and on its assumptions. Example: an 80% success rate means the plan worked in 80 of every 100 scenarios.
- Block bootstrap
- What it is: building a scenario by joining blocks of consecutive real years, picked at random. Who it helps: people who want history-based tests with many scenarios. When to use it: when comparing stress-test methods. The catch: it still assumes the future will look like the past. Example: joining 7-year blocks keeps a crash and its recovery together.
Frequently asked questions
- What is a Monte Carlo retirement simulation?
- It runs your retirement plan many times with different sequences of market returns (and often inflation) and counts how often the money lasts. The result is usually shown as a percentage, such as an 85% chance of success.
- What is a good Monte Carlo success rate for retirement?
- There is no single right number. A higher rate means more cushion but usually less spending. Boldin says its Safe Spending Target aims for roughly an 80% Chance of Success, with 70% and 95% as lower and upper guardrails. WisePlan Wealth’s in-app guidance calls 85% or higher a strong Market Resilience result and suggests 80% as a baseline. What matters most is what “failure” means in the tool you use.
- Is a historical simulation better than random Monte Carlo?
- Each has trade-offs. Random (statistical) Monte Carlo can create crashes worse than history but may miss real patterns such as runs of bad years. Historical sequences keep real patterns but there is only so much history. Some apps blend the two by drawing blocks of real history.
- Which retirement apps have Monte Carlo?
- Boldin lists Monte Carlo analysis in PlannerPlus ($144 a year) and says it runs 1,000 simulations. ProjectionLab lists Monte Carlo simulations and historical backtesting in its free Basic plan. WisePlan Wealth’s Market Resilience score uses 7-year blocks of real historical returns and inflation.
- How does WisePlan Wealth’s Market Resilience work?
- Each scenario strings together 7-year blocks of real annual returns and inflation from 99 years of history (1926 to 2024), adjusted so the average matches the return you set. A scenario counts as a success if the plan pays its spending to the life expectancy you enter and leaves more than your Minimum Legacy. It does not use random lifespans.
Sources (checked 7 October 2026)
- Boldin pricing (Monte Carlo analysis in PlannerPlus)
- Boldin: ProjectionLab vs. Boldin (1,000 simulations, Chance of Success)
- ProjectionLab pricing (Monte Carlo and historical backtesting in Basic)
- App Store listing for WisePlan Wealth: version 1.8 notes on Market Resilience
- Google Play listing for WisePlan Wealth: what’s new in 1.8
Related retirement planning guides
- Free retirement budget calculator: what your pensions, income and savings give you each month, next to your spending.
- Retirement planning apps compared: Boldin, ProjectionLab, Empower, Optiml and more, side by side.
- Retirement planning app for Canada: what an app must model for CPP, OAS, GIS, RRSP and TFSA.
- Retirement planning app for the US: Social Security, 401(k), IRA, Roth and RMDs.
- Retirement planning in Canada: a 7-step guide: spending target, CPP, OAS, savings, withdrawals and risk.
- Retirement income planning in Canada: turning CPP, OAS, pensions and RRIF withdrawals into a monthly income.
- Retirement planning for couples: two sets of benefits, pension splitting and survivor years.
- Retirement planning at 50: catch-up savings, a target and a first projection.
- Retirement planning at 60: benefit start ages, the bridge years and RRSP to RRIF.
- Free retirement planning apps and calculators: what free tools do and where the paid tiers start.
- DIY retirement planning vs a financial advisor: what you can do yourself and when advice is worth paying for.
- Retirement planning app for iPhone, iPad and Mac: what to look for in an Apple retirement planner.
- Retirement planning app for Android: what to look for in an Android retirement planner.
- Retirement planning software for individuals: web planners, apps and spreadsheets compared.
Not financial, tax, investment, legal or accounting advice. Competitor details come from each company’s own website on 7 October 2026 and can change. WisePlan Wealth Ltd. is not affiliated with the other companies named. Page dated 7 October 2026.